When we think about large organizations, we tend to picture structured roles, functions, and processes. However, behind the scenes, they consist of networks of people connected through social relationships and interactions. These networks often display emergent properties and give rise to spontaneous dynamics that are difficult to understand from the outside. Network science is the study of these complex systems, whose behavior depends on decentralized interactions. In network models, nodes are entities that interact with one another, and edges (or ties) represent the existence, intensity, and valence of these interactions. When such a system represents a social network, nodes typically correspond to individuals, and ties are formed through interactions such as talking to one another, working together, or exchanging resources.
Methods for network analysis and modeling can measure, map, and predict a wide range of phenomena, such as – for example – social cohesion; the diffusion of ideas and innovations; power dynamics; and influence within social groups. In particular, when we study an organization as a social network, we are able to observe the webs of informal relationships and interactions that sustain it, nourish it, and ultimately allow it to thrive or cause it to fail. The hidden structure and functioning of social networks can be analyzed to explain fundamental processes in organizational life, such as the adoption of innovations within the workforce (for example, new AI tools); resilience in the face of factors that generate disruption or organizational crises (for example, turnover, managerial transitions, and conflicts); or the ability to retain talent and create effective career pathways.
In this analysis, we used the tools of network science to investigate one of the longest-standing business communities designed and managed by Logotel. This community, dedicated to the consumer sales network of a large organization in the advanced service sector, represents an interesting example of a work environment that depends heavily on a large and complex network of human relationships and interactions. This complexity also stems from the type of community members, who are not classified as employees but – as is often the case in sales networks – participate in the network through different forms of collaboration. As a result, the cohesion and resilience of this network are essential to sustaining the organization’s sales performance.
To map and measure the structure of this network, we used data on posts and replies published on the platform by community members from October 2023 to July 2025. One objective of the study was to identify the key players – the central figures in the network structure who therefore prove to be crucial to the cohesion and functioning of the community. We sought to understand which types of users tend to assume this role and how these key positions emerge. We were also interested in describing subgroups or clusters of users with high levels of interconnection. Finally, through a scenario simulation, we aimed to anticipate what would happen to the community if some key players were to leave, and how resilient the network structure would be to this type of shock.
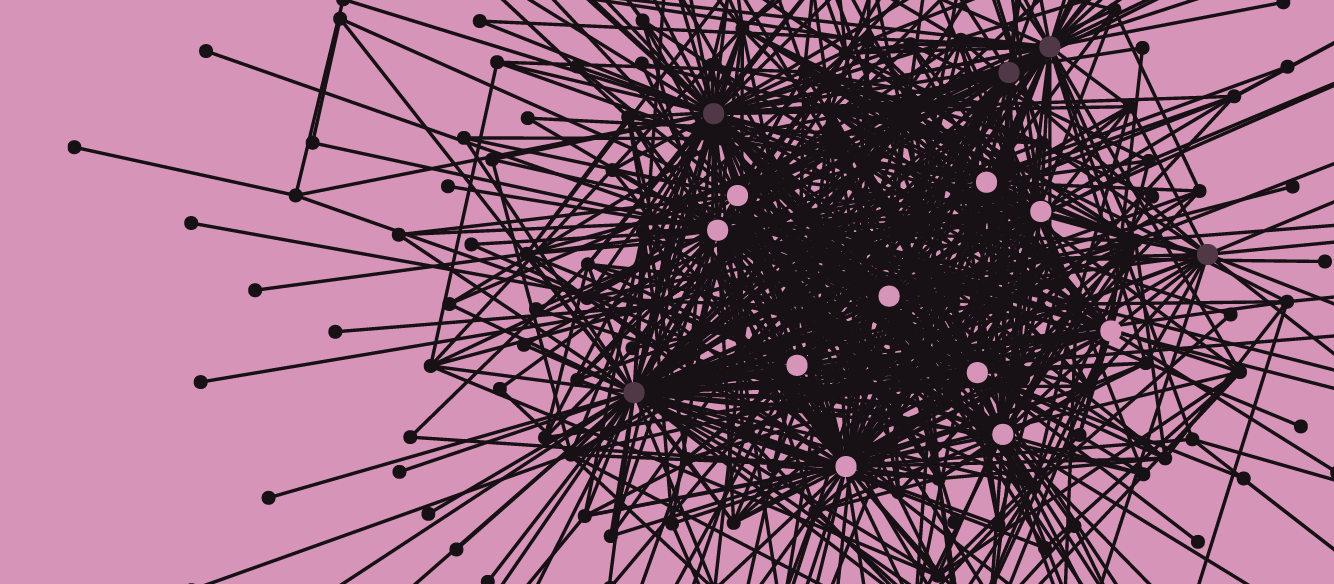
We found that the shape of the community corresponds to what network scientists call a “core-periphery structure” (see Figure 1). Structures of this kind are composed of a central core, which is highly cohesive and made up of very active users, and a periphery that is more loosely connected, whose activity gravitates around the core.
Figure 1. The core-periphery structure of the community. Each node represents a user, and two users are connected if they have replied to each other’s posts at least once.
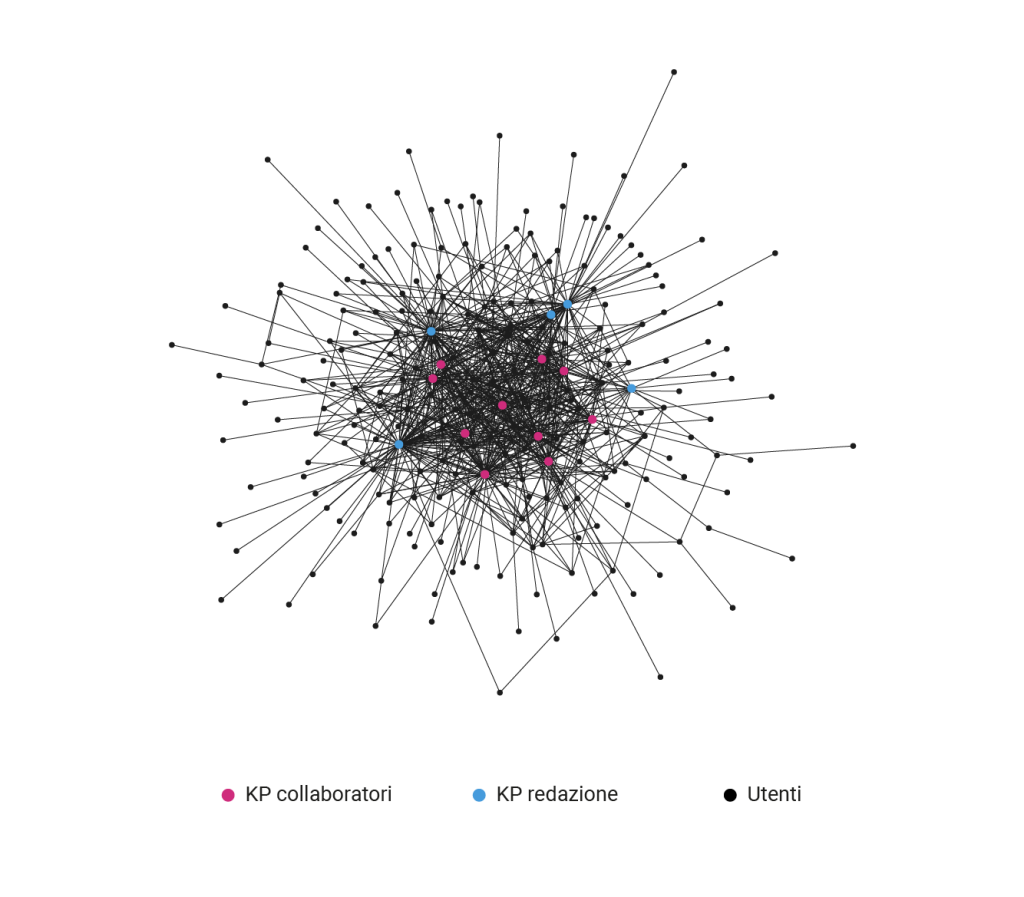
The analyses identified fifteen key players (KP), approximately 5 percent of the user population (the colored nodes in Figure 1). They were identified on the basis of a combination of three factors that measure centrality in network analysis – degree centrality, eigenvector centrality, and betweenness centrality. Degree centrality is the number of connections of a node, a basic measure of connectivity and individual activity in the network. Eigenvector centrality is a recursively weighted form of degree centrality, in which greater weight is assigned to connections with nodes that are themselves highly connected to others. Eigenvector centrality is therefore high when a node has many connections with nodes that, in turn, have many connections. Betweenness centrality, by contrast, measures the extent to which a node lies “in between” other nodes, that is, on the shortest network paths that connect them. This measure is useful for identifying individuals who act as bridges between areas of the network that would otherwise be disconnected.
Ten of the fifteen key players are collaborators in the sales network, located in various Italian provinces, including Turin, Milan, Venice, Macerata, Sassari, and Trapani. The remaining five are members of the Logotel editorial team, which develops editorial plans as well as training and engagement programs (the green nodes). From the position that key players occupy within the network, it emerges that collaborator KPs are the glue that holds the core of the network together. They occupy critical junctions at the heart of the relational structure of the business community. Because they are in this position, they obtain higher scores than ordinary users both in terms of degree centrality and eigenvector centrality (see Figure 2). In contrast to the editorial KPs, collaborator KPs display a lower median degree centrality but a higher eigenvector centrality. This means that this type of KP tends to have a smaller number of connections, but more “strategic” ones, compared with editorial KPs. In other words, collaborator KPs interact with fewer people, but with people who are better connected, than editorial KPs. In this way, collaborator KPs are positioned at the center of activity, deeply embedded and actively engaged in the most active core of the community.
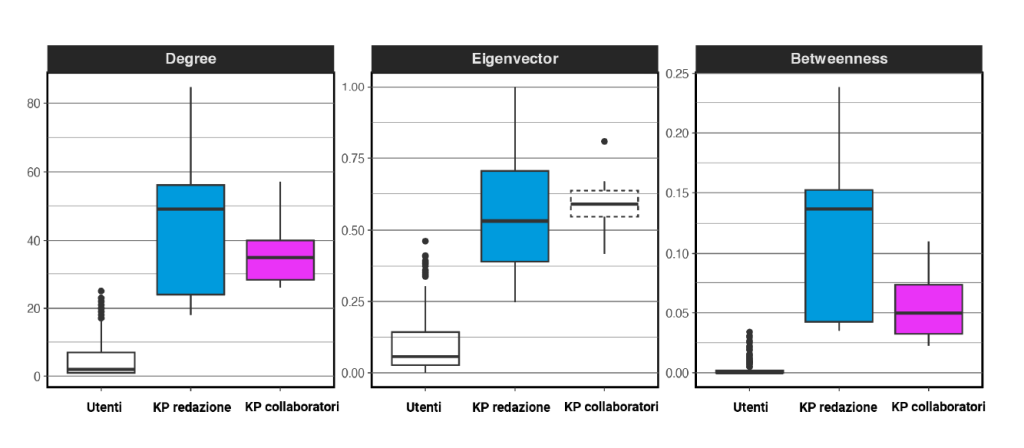
Figure 2. The distribution of three network centrality measures in the community.
By contrast, the editorial KPs form a sort of ring around the core, acting as a bridge between the center and the rest of the network. This is reflected in higher betweenness centrality scores (see Figure 2), which show that editorial KPs lie on the shortest network paths connecting many pairs of nodes between the core and the periphery.
How does one become a key player in a business community of this kind?
Part of the answer lies in the centrality measures we have just discussed. A user becomes a key player through a high number of posts and replies, generating many interactions with others (degree centrality); a set of “strategic” interactions with other users who are themselves highly central (eigenvector centrality); and by acting as a bridge, that is, by spanning the distance between the core and the periphery of the network (betweenness centrality).
There are, however, additional elements that define key players. These relate to readiness and activation time, namely the ability to respond to and react to what happens in the community earlier than others. Our analysis showed that KPs tend to publish messages and replies more quickly when a “critical event” occurs in the life of the business community. In a sales network, critical events include, for example, the launch of new offerings that differ substantially from previous ones, possibly developed in partnership with new actors or based on new technologies. For collaborators, this represents a shock, because the new offering entails the need to seek information, undergo training, and learn the content required to sell the new service or product; to develop new behaviors for interacting with customers; and – more generally – to move beyond the comfort zone that leads people to sell only what they are already familiar with.
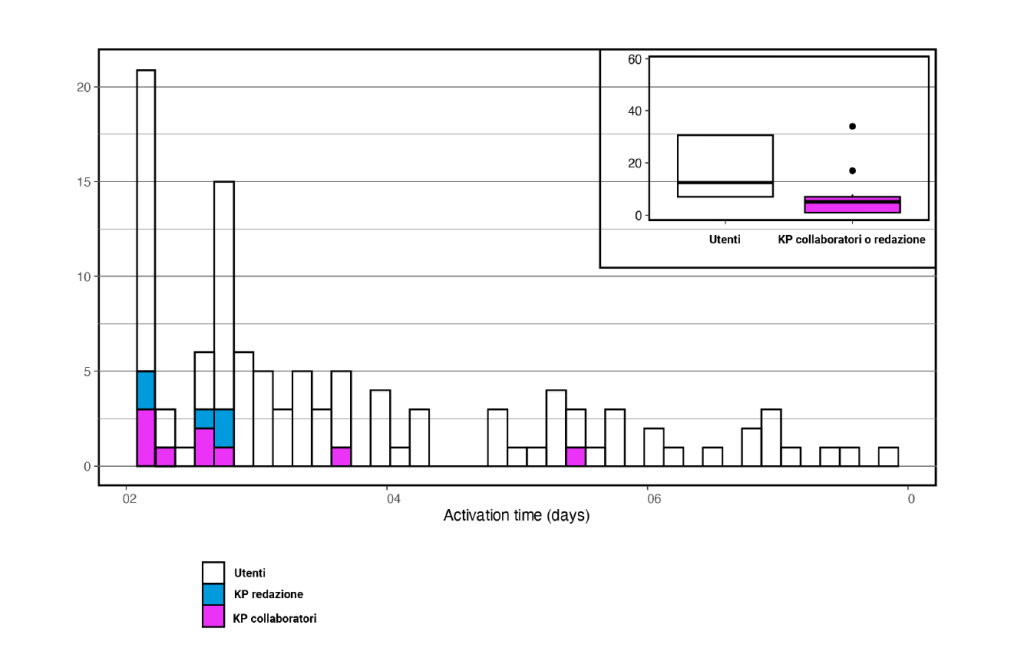
Figure 3 clearly shows the activation capacity of key players. After identifying a critical event, we observed that they take approximately one week to publish a message or a reply. This corresponds to about half of the median activation time observed among regular users, who instead take around two weeks. More generally, the activation times of both collaborator KPs and editorial KPs are distributed around much lower numbers of days (magenta and light blue in Figure 3) compared with those of general users (white in the figure). This rapid activation acts as a driving force for the rest of the community, encouraging the entire network to become familiar with new content, request additional information, and engage in interaction.
Figure 3. Activation times on the platform by user type following the launch of a new offering.
So far, we have considered only the static aspects of social networks, such as the position of some more central individuals, or the way in which certain nodes form a highly interconnected core while others remain in the periphery. Social networks, however, are in fact dynamic systems that change, evolve, and experience crises and disruptions. The resilience of a system – that is, its ability to recover and successfully adapt after a crisis or a shock – depends precisely on its network, the hidden and adaptive structure that emerges from relationships among its members. One of the most common types of organizational shock is the departure of one or more members, due – for example – to retirement or a change of job. For this reason, part of our analysis focused on measuring the resilience of the business community managed by Logotel following the departure of key players.
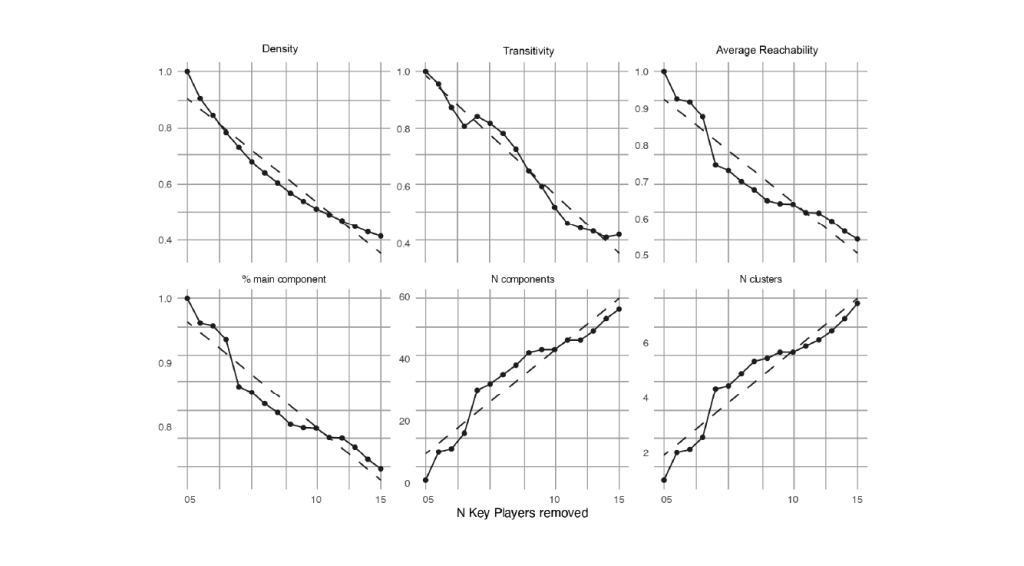
We asked ourselves: what would happen to this network if its most critical nodes were removed? Would the network preserve its overall configuration and structural properties, or would it rapidly break apart into a dispersed and dysfunctional set of small, disconnected groups? We can address these questions by calculating measures of network cohesion (such as density and average reachability) and fragmentation (such as the number of disconnected components), and then mapping how these measures evolve after the departure of key players (see Figure 4).
When the most central nodes leave the network, cohesion decreases and fragmentation increases – an inevitable trend in all such systems. In networks with low resilience, however, this dynamic is exponential, discontinuous, or occurs in “steps”, leading to a very rapid collapse of the system’s connectivity structure. By contrast, in our simulations, the business community managed by Logotel displayed a high level of resilience. In Figure 4, we see that as key players are progressively removed (from the most central to the most peripheral), the structure of the network changes in a gradual and linear manner, without any abrupt collapse. The linearity of this change is reflected in several indicators of cohesion and fragmentation, ranging from network density and average node reachability – measures of the network’s overall connectivity and of nodes’ ability to reach one another – to the number of components and clusters in the network, that is, how many groups split and become disconnected as the number of key players decreases.
Figure 4. Measures of network cohesion and fragmentation as key players are removed.
Overall, these analyses demonstrate the value of applying a network-science approach to the study of organizations and the communities of people that support them. Network analysis reveals their hidden structure, allowing us to bring quantitative precision to otherwise vague concepts such as centrality and groups. These methods also help us to understand the dynamics of interconnected communities and what makes them more or less resilient to challenges that arise within or outside organizations.
Ultimately, much like microscopes for biologists and telescopes for astronomers, the tools of network science offer us a completely new way of seeing human systems. They enable us to explain and anticipate organizational processes that would otherwise be impossible to understand. Mapping the structures of these networks within organizations and business communities can also be valuable for decision makers, as it allows them both to better understand the effects of the strategies they implement and to critically assess their own top-down initiatives through a new perspective – that of insights emerging from exchanges, interactions, and social dynamics in contemporary organizations.